Specific data on school leaving
While the data on school leaving in Canada and Québec, and on graduation and qualification in Québec generally and in Montréal collated by Réseau Réussite Montréal (2018) present an enlightening portrait of the situation, the regional particularities that exist in Gaspésie—Îles-de-la-Madeleine merit a closer look, more specifically with respect to school retention and leaving.
School leaving rates in the Gaspé and the Magdalen Islands
According to Ministère de l’Éducation et de l’Enseignement supérieur (MEES) data on young people exiting general education programs in the public system without a diploma or qualification, 20.5% of the boys and 9.5% of the girls (a gap of 11 percentage points) left school early. Compared to data for the whole of Québec, boys in the region drop out of school more often (gap of 1.3 percentage points) while girls drop out less often (2.4 percentage points). The drop-out rate for girls in the region is the second lowest in Québec (CSF, 2013).
The Fédération autonome de l’enseignement (FAE, 2015, p. 6) noted a crucial element in terms of the drop-out rate since MEES “bases its calculations on the number of young people without DES (secondary school diploma) at the age of 19 (21.6% for boys and 12.4% for girls). In contrast, the Organisation for Economic Cooperation and Development (OECD) and Statistics Canada base their calculations on the number of young people without a secondary school diploma at 24 years of age and who no longer attend school (10.3% for boys and 6.6% for girls). These different ways of measuring the data produce completely different portraits of the gap between boys and girls, which is much smaller in the latter case.” This would mean that boys return to school more frequently than girls.
The drop-out rate for boys in GÎM fell by 7.3 points in 15 years, a less marked drop than in the province on the whole. During the same period, the drop-out rate for girls also fell at a proportion equal to that of the boys (7.5. percentage points). This once again illustrates the region’s specificity, since the drop-out rate for girls has fallen more quickly than that for boys throughout the province.
Figure 1: Annual rate of youths leaving general education programs in the public system without a diploma or qualification (annual school leaving), Gaspésie-Îles-de-la-Madeleine, by gender
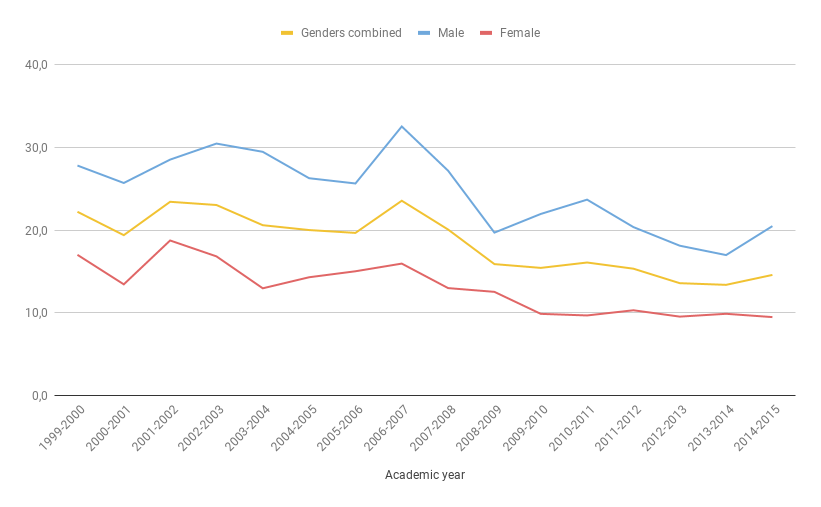
Source: MEES, TSE, DGSEG, DIS, Charlemagne system, special compilation
School leaving rates by gender at school boards and in RCMs
While the Gaspésie—Îles-de-la-Madeleine region presents trends that differ from what is seen elsewhere in Québec in terms of school-leaving rates, what is the situation for these parameters within the region’s school boards and RCMs?
A look at Figure 2 reveals considerable differences between the region’s school boards (commission scolaire – CS). While the gap between drop-out rates for girls and boys at CS René-Lévesque is quite small (4 points), the gap grows to 8.2 points at CS des Îles and 23.7 points at CS des Chic-Chocs, an alarming gap more than three times higher than the provincial average.
Figure 2: Rate of youths leaving general education programs without a diploma or qualification (annual school leaving), by school board, 2014-2015
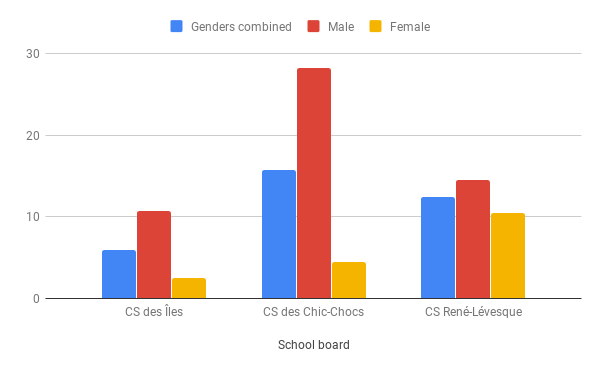
Source: MEES, TSE, DGSEG, DIS, Information portal, Charlemagne system, data consulted on 2016-08-04, November 2016
By looking at school leaving rates by RCM, we can more finely analyse the local realities that exist within Gaspésie—Îles-de-la-Madeleine. The highest school-leaving rates were observed in Haute-Gaspésie (27.1% for boys and 19.4% for girls). The lowest school-leaving rate for boys occurs in the MRC du Rocher-Percé while for girls, the lowest rate occurs in the MRC Bonaventure. The only school-leaving data available by RCM are those for 2011-2013, which explains the difference in data for CS des Îles for 2014-2015.
The largest gap between school leaving by girls and boys exists in Îles-de-la-Madeleine (19.3 points) while the lowest gap exists in the MRC d’Avignon (0.9 points), where school-leaving rates hover around 15%. This precise portrait of school leaving within Gaspésie—Îles-de-la-Madeleine can be used to introduce tools and practices adapted to the particularities that exist in our communities.
Figure 3: Rate of youths leaving general education programs without a diploma or qualification (annual school leaving), by RCM, 2011-2013
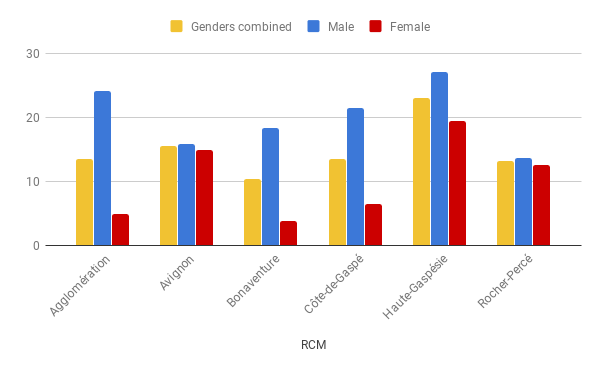
Source: http://cartojeunes.ca
Graduation and qualification rates in Gaspésie-Îles-de-la-Madeleine
The gap between graduation and qualification rates for girls and boys after seven years, for the 2009-2010 cohorts, is 12.7 points, with the gap shrinking by 3.4 points over this time. The graduation rate for boys increased, during this same period, more significantly (3 points) than the graduation rate for girls.
Figure 4: Evolution in graduation and qualification rates (in %) by gender, Gaspésie-Îles-de-la-Madeleine
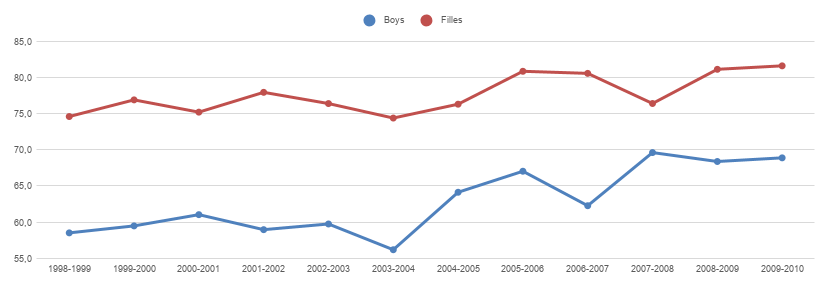
Source: Charlemagne system, Ministère de l’Éducation et de l’Enseignement supérieur (MEES), data obtained from the Infocentre de santé publique by DSP GIM
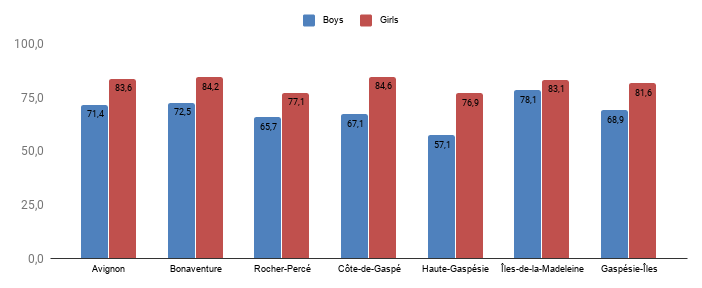
A closer look at graduation and qualification rates for the most recent cohort (2009-2010) by RCM reveals considerable differences in regional realities. While the gap between graduation and qualification rates for girls and boys on the islands is only 5 points, the gap between the two rates in Haute-Gaspésie is more than 17 points.
Figure 5: Graduation and qualification rates (in %), by gender and home RCM, Gaspésie-Îles-de-la-Madeleine, 2009-2010 cohort
Finally, when the situation in Gaspésie—Îles-de-la-Madeleine is compared to that in Québec on the whole, the gap between rates remains constant on average, at about 3 percentage points.
Figure 6: Evolution in graduation and qualification rates (in %), genders combined, Gaspésie-Îles-de-la-Madeleine and Québec (all public, private and government schools)
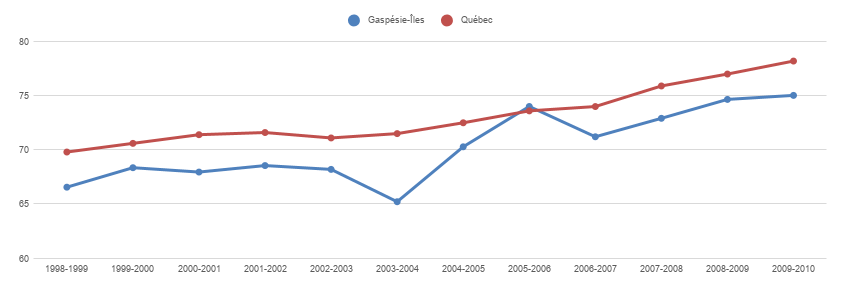
Source: Charlemagne system, Ministère de l’Éducation et de l’Enseignement supérieur (MEES), data obtained from the Infocentre de santé publique by DSP GIM
Francophone, Anglophone and Mi’gmaq communities: are there any differences?
The Gaspésie—Îles-de-la-Madeleine region is home to three main linguistic communities, Francophone, Anglophone and Mi’gmaq, with the latter two communities being in the minority. Unfortunately, data on school leaving and graduation for the three Mi’gmaq communities in the region are not available. In Québec on the whole, however, “the annual school-leaving rate is very high in the three special-status school boards where a large proportion of the students are Indigenous. This rate was 61.3% in 2011-2012.” (MEESR, 2015, p. 7).
As for the Anglophone communities, the most recent school-leaving rates (2014-2015) are much higher at Eastern Shores school board (30.4% for boys and 21.7% for girls) than at the region’s other school boards. The gap between boys and girls, however, is similar to that observed at CS des Îles, about 8.5 percentage points. Note that Eastern Shores school board also includes Côte-Nord Anglophone schools.
Figure 6: Rate of youths leaving general education programs without a diploma or qualification (annual school leaving), by school board, 2014-2015
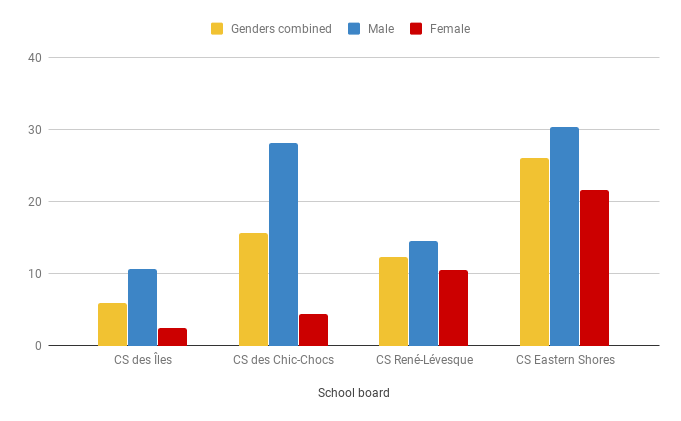
Source: MEES, TSE, DGSEG, DIS, Information portal, Charlemagne system, data consulted on 2016-08-04, November 2016
Socio-economic portrait of Gaspésie et des Îles-de-la-Madeleine
Knowledge of the socio-economic situation and job-related specificities that exist within the Gaspésie—Îles-de-la-Madeleine region can foster a comprehensive understanding of the school-leaving phenomenon and the perpetuation of sexual stereotypes in the region.
Mothers’ schooling
First of all, it is important to know that socio-economic disadvantage is one of the risk factors that most impact school leaving (RRM, 2018). This being said, it is particularly tied to under-education in mothers, which has a recognised impact on their children’s obtaining a first diploma: children whose mothers have no diploma or who are undereducated are more likely to drop out than other children (Fédération autonome de l’enseignement [FAE] and Relais-femmes, 2015).
In Gaspésie—Îles-de-la-Madeleine, the schooling of mothers is evaluated by looking at the highest level of schooling obtained by women between 25 and 64 years of age. It is hard to know precisely and reliably the mothers’ levels of schooling since, until 2005, the birth report asked mothers how many years of schooling they had; in contrast, since 2005, the form requires mothers to indicate the highest level of schooling they successfully completed, providing them with 4 possible answers to choose from: Elementary school, Secondary school, College or University. This being said, it may very well be that some women, who were last enrolled in Secondary 3 for instance, checked the box for Secondary, while they should have checked Elementary. This explains why the measurement used for the evaluation was the highest level of schooling attained by people between 25 and 64 years of age, wording that has not changed over the years.
In 2014, it is estimated that 21.6% of the women in this age group did not have any diploma and that about 12.7% had only a secondary school diploma. A closer look at the schooling of women in the region between the ages of 25 and 54, by place of residence in 2016, shows that the level of schooling most often attained is college, that women in the Rocher-Percé and Haute-Gaspésie RCMs are proportionally more likely (>20%) to not have any diploma and that the women with the highest levels of schooling live in Côte-de-Gaspé where the post-secondary graduation rate is 76.1%.
Figure 7: Breakdown (in %) of women by highest certificate, diploma or degree, and by place of residence, 2016
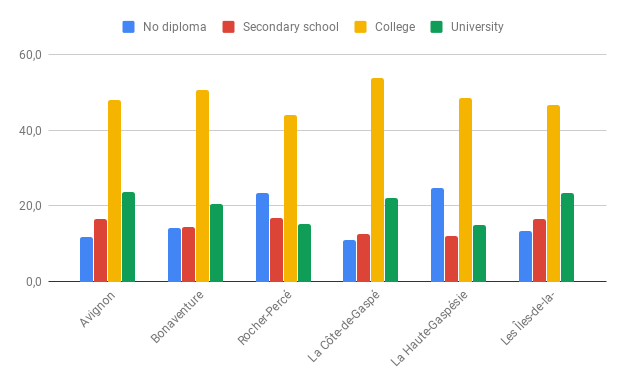
Source: Statistics Canada, 2016 Census, Table 98-400-X2016242, Data compiled by DSPGIM
Socio-economic levels of men and women
Even today, the male-female wage gap is still evident in Gaspésie—Îles-de-la-Madeleine. In fact, in 2017, men earned an average weekly wage of $974.53 compared to $765.32 for women, equivalent to average hourly wages of $24.37 for men and $22.82 for women (ISQ, 2018). But these encouraging figures hide a darker reality: 18.12% of women and 16.63% of men live below the low-income cut-off. The Gaspésie—Îles-de-la-Madeleine Anglophone population holds the record for Canada’s poorest socio-economic status, taking into consideration low schooling rates, unemployment and the low-income cut-off (Bright Beginnings, 2017).
Gender segregation in the workplace
Sexual stereotypes not only exist in early childhood and at elementary schools: the occupational segregation between men and women observed in Gaspésie—Îles-de-la-Madeleine is strongly marked by these stereotypes. Of the 15 main occupations held by men in the region in 2015, nine had male gender ratios greater than 80%. The same trend was observed for women: 10 of the 15 occupations had female gender ratios greater than 80%.
In some occupations, such as Retail salespersons, parity was nearly attained. But it is a fact that within this occupational category, women primarily hold subaltern positions while men sell more vehicles, large appliances, earning 50% more in employment income (Rose, 2016).
Table 1. Principal occupations held by men earning employment income in 2015, GÎM
| Occupations | Male gender ratio |
|---|---|
| 7311 Construction millwrights and industrial mechanics | 101% |
| 7321 Automotive service technicians, truck and bus mechanics and mechanical repairers | 100% |
| 7271 Carpenters | 99% |
| 7521 Heavy equipment operators (except crane) | 99% |
| 7511 Transport truck drivers | 98% |
| 7611 Construction trades helpers and labourers | 92% |
| 8262 Fishermen/women | 91% |
| 8441 Fishing vessel deckhands | 89% |
| 6733 Janitors, caretakers and building superintendents | 83% |
| 6622 Store shelf stockers, clerks and order fillers | 76% |
| 0621 Retail and wholesale trade managers | 57% |
| 9618 Labourers in fish and seafood processing | 55% |
| 6421 Retail salespersons | 45% |
| 6731 Light duty cleaners | 32% |
| 6322 Cooks | 23% |
Source: Special compilation, Statistics Canada 2016 Census
Table 2. Principal occupations held by women earning employment income in 2015, GÎM
| Occupations | Female gender ratio |
|---|---|
| 4214 Early childhood educators and assistants | 98% |
| 1241 Administrative assistants | 96% |
| 4412 Home support workers, housekeepers and related occupations | 93% |
| 4032 Elementary school and kindergarten teachers | 91% |
| 6611 Cashiers | 90% |
| 1221 Administrative officers | 89% |
| 4212 Social and community service workers | 88% |
| 6513 Food and beverage servers | 87% |
| 3413 Nurse aides, orderlies and patient service associates | 87% |
| 3012 Registered nurses, registered psychiatric nurses | 87% |
| 6322 Cooks | 78% |
| 6711 Food counter attendants, kitchen helpers and related support occupations | 77% |
| 6731 Light duty cleaners | 69% |
| 6421 Retail salespersons | 55% |
| 9618 Labourers in fish and seafood processing | 45% |
Source: Special compilation, Statistics Canada 2016 Census
This striking segregation appears to exist as well at the provincial level, as suggested by the occupational choices of young people still at school, particularly in terms of secondary school-level occupational training and college-level technology programs (Rose, 2016).
In the region, enrolment in technology programs offered by the Cégep de la Gaspésie et des Îles-de-la-Madeleine (CGÎM) is no exception: most of the technology programs have female gender ratios that are consistent with the traditionally masculine or feminine character of their activity sector, the exception being Adventure tourism and Accounting and management, whose female gender ratio neared parity (40%-60%) several times in recent years. The small number of students per cohort at CGÎM is the reason for the great year-to-year variations for all CGÎM data.
Table 3. First-year female gender ratio by technology program
The dash means that the program was offered but that there was no enrolment. An empty cell means the program was not offered that year. The letters in brackets indicate whether technology programs are traditionally female (F), male (M) or mixed (F=M).
| Program | 2008 | 2009 | 2010 | 2011 | 2012 | 2013 | 2014 |
|---|---|---|---|---|---|---|---|
| Office systems (F) | 100.0 | - | 87.5 | ||||
| Computer science (M) | 0.0 | 0.0 | 0.0 | 0.0 | 0.0 | - | - |
| Adventure tourism (M) | 45.7 | 40.5 | 42.3 | 25.0 | 22.7 | 40.0 | 21.6 |
| Medical records management (F) | 71.4 | 100.0 | 93.3 | ||||
| Accounting and management (F) | 76.0 | 56.0 | 73.9 | 50.0 | 60.7 | 64.9 | 52.8 |
| Social work (F) | 91.7 | 83.3 | 73.9 | 84.2 | 63.6 | 76.9 | 86.1 |
| Special care counselling (F) | 100.0 | 75.0 | 72.2 | 73.3 | 72.2 | 78.9 | 80.1 |
| Early childhood education (F) | 100.0 | 100.0 | 100.0 | 100.0 | 100.0 | 100.0 | 100.0 |
| Youth and adult correctional intervention (F) | 88.0 | 80.6 | 66.7 | 77.4 | 68.2 | 87.5 | 86.4 |
| Industrial electronics (M) | 0.0 | - | 0.0 | - | 25.- | 0.0 | - |
| Industrial maintenance (M) | - | - | 12.5 | 0.0 | 0.0 | 20.0 | 10.0 |
| Aquatic product processing (F=M) | 81.8 | 0.0 | - | - | - | - | - |
| Aquaculture (F=M) | 20.0 | 33.3 | 66.7 | - | - | - | 33.3 |
| Forest technology (M) | - | - | - | 18.8 | 12.5 | 60.0 | 16.7 |
| Nursing (F) | 94.4 | 78.3 | 76.2 | 72.4 | 88.9 | 83.9 | 82.6 |
| Total: technology | 73.7 | 62.4 | 60.1 | 55.8 | 57.6 | 69.9 | 63.0 |
Source: Special compilation, Cégep de la Gaspésie et des Îles-de-la-Madeleine, 2018
Looking at overall female gender rates, it can be concluded that women are in the majority (63% in 2014) in technology programs offered at CGÎM, which is quite close to Ministère de l’Économie, de la Science et de l’Innovation (MESI, 2014, p. 10) data, which reported that in 2013, “women account for 59.7% of the total enrollment in full-time technology education in mainstream instruction”.
Does this enrolment translate into graduation? To facilitate the analysis of graduation rates for various programs, we will first look at traditionally female technology programs. Setting aside data for programs where fewer than five people enrolled (identified by an *), we see that men, proportionally, more often obtain their diplomas in Accounting and Management and in Nursing than their female colleagues despite the fact that they are in minority) and than their colleagues in the college system on the whole. The situation differs in Social work, Correctional intervention and Special care counselling, where the male students’ graduation rates are quite a bit lower than those of female students, but where male enrolment is also quite low. Finally, there are no men enrolled in the Early childhood education program.
Table 4. Graduation rates, 2 years after the minimum duration of schooling
A dash in a cell indicates that either no young men or women enrolled in this program or the cohort did not begin the program. if the data are marked with an asterisk, this means that there were fewer than five students enrolled in the first year and consequently, these data should be interpreted prudently.
| Program | 2008 | 2009 | 2010 | 2011 | 2012 |
|---|---|---|---|---|---|
| F | M | F | M | F | M | F | M | F | M | |
| Accounting ang management | 79.0 | 100 | 42.9 | 81.8 | 64.7 | 66.7 | 50.0 | 50.0 | 70.6 | 72.7 |
| Social work | 77.3 | 50* | 55.0 | 0* | 52.9 | 50.0 | 68.8 | 33.3* | 71.4 | 75* |
| Special care counselling | 53.3 | - | 91.7 | 50.0* | 69.2 | 20.0 | 45.5 | 25.0* | 76.9 | 60.0 |
| Early childhood education | 46.7 | - | 83.3 | - | 87.5 | - | 33.3 | - | 100 | - |
| Youth and adult correctional intervention | 45.5 | 33.3 | 68.0 | 66.7 | 59.1 | 45.5 | 50.0 | 100 | 46.7 |57.1 |
| Nursing | 82.4 | 100* | 55.6 | 80.0 | 43.8 | 100 | 71.4 | 87.5 | 80.0 | 40.0 |
Source: Special compilation, Cégep de la Gaspésie et des Îles-de-la-Madeleine, 2018
When analysing the graduation rates for traditionally male technology programs, the first observation is that girls are nearly absent from these programs, which is consistent with the occupational segregation observed on the labour market and presented in tables 1 and 2. Only in the Adventure Tourism program are women significantly present and in this program, all things being equal, they obtain their diplomas more often than their male classmates.
Table 5. Graduation rates, 2 years after the minimum duration of schooling
| Programs | 2008 | 2009 | 2010 | 2011 | 2012 |
|---|---|---|---|---|---|
| F | M | F | M | F | M | F | M | F | M | |
| Computer science | - | 100 | - | 100 | - | 28.6 | - | 33.3* | - | 33.3* |
| Adventure tourism | 56.3 | 47.4 | 86.7 | 54.6 | 63.6 | 50.0 | 70.0 | 66.7 | 70.0 | 61.8 |
| Industrial electronics | - | 100 | - | - | - | 25.0* | - | - | 100* | 100* |
| Industrial maintenance | - | - | - | - | 100* | 57.14 | - | 50.0 | - | 75.0 |
| Forest technology | - | - | - | - | - | - | 0* | 53.9 | 100* | 71.43 |
Source: Special compilation, Cégep de la Gaspésie et des Îles-de-la-Madeleine, 2018
As for the pre-university sector, female Gaspesians and Magdalen Islanders enrol in these programs in greater numbers than their male classmates, in proportions that are slightly higher than in the province on the whole (CGÎM, 2018; MESI, 2014). While they remain proportionally more numerous in Social science, most of the women enrolled at CGÎM study Arts, Literature and Communication, where their enrollment number is equal to that of their male counterparts, as well as Science (Table 6).
Table 6. First-year female gender ratios by pre-university program
| Program | 2008 | 2009 | 2010 | 2011 | 2012 | 2013 | 2014 | Average |
|---|---|---|---|---|---|---|---|---|
| Art, literature and communication | 43.8 | 71.0 | 78.9 | 60.0 | 72.7 | 57.1 | 33.3 | 59.6 |
| Social science | 64.0 | 64.1 | 65.2 | 67.6 | 71.9 | 63.6 | 65.5 | 66.0 |
| Science | 58.4 | 57.0 | 61.3 | 61.7 | 59.4 | 63.6 | 67.9 | 61.3 |
| Total pre-university | 60.7 | 62.5 | 65.1 | 64.6 | 67.7 | 63.2 | 64.9 | 64.1 |
Source: Special compilation, Cégep de la Gaspésie et des Îles-de-la-Madeleine, 2018
As for the graduation rate for pre-university programs, we see that like the data available for secondary school, more young women than men obtain their diplomas in all three programs. The gap is larger in Arts, literature and communication (30.1 percentage points) and smaller in Computer science (3.9 percentage points) where students, both male and female, most often obtain their diplomas in greater proportions than their peers elsewhere in the province. Finally, in Social science, there is a 12.8% graduation gap between female and male students enrolled in the program.